Trip Transformations: Predicting Performance When Horses Tackle New Distances
2 Apr 2026
Trip Transformations: Predicting Performance When Horses Tackle New Distances
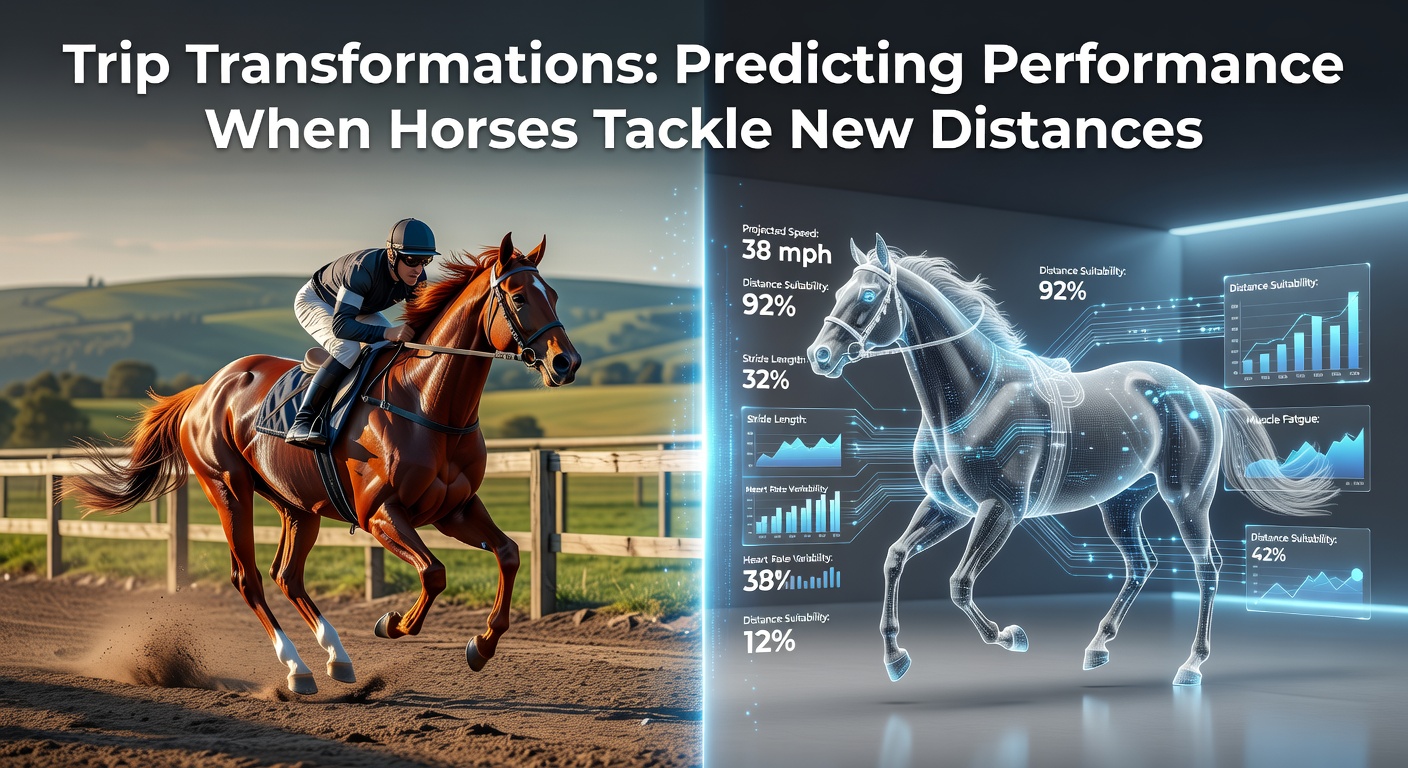
Horses stepping up or down in trip length often reshape race outcomes, yet observers note how patterns in past data reveal which ones thrive under such changes; take the stretch from sprints to routes, where front-runners falter while closers surge ahead, or vice versa when stamina meets speed tests.
Experts tracking Thoroughbred performances have long dissected these shifts, finding that success hinges on a mix of pedigree signals, running styles, and trainer tactics, especially as April 2026 approaches with key preps like the Lexington Stakes looming on US tracks and Australian Oaks trials heating up Down Under.
Pedigree as the First Clue
Breeding backgrounds provide the strongest baseline for distance predictions, since sires and dams imprint specific aptitudes on offspring; data from Equibase charts shows progeny of stamina sires like Galileo dominating beyond 10 furlongs, whereas speed-oriented lines from Storm Cat excel in six-furlong dashes.
Those who've pored over genetic databases discover that dam-side influence often trumps sire in extreme stretches, with mares from staying families producing routers who handle 12 furlongs comfortably, even if the father brings sprint blood; one study from the University of Kentucky's Gluck Equine Research Center highlights how 68% of horses extending trips by two furlongs or more carry dams with proven middle-distance wins.
But here's the thing: hybrid pedigrees create wild cards, blending sprinter speed with stayer endurance to produce versatile types that adapt seamlessly, turning potential upsets into calculated plays when races hit unfamiliar ground.
Analyzing Past Performances for Trip Clues
Race charts offer immediate snapshots of how horses handle pace scenarios at prior distances, revealing whether a contender tires late in sprints or quickens best over routes; sectional timings prove crucial here, as horses posting strong final furlong fractions in mile races signal readiness for longer hauls.
Observers point out that beaten favorites dropping back in trip after route failures rebound sharply if their charts show early zip, while sprinters stretching out flop unless final splits indicate hidden stamina; Equibase speed figures adjusted for distance variants confirm this, with horses improving ratings by 5-10 points on average when matching pedigree to new trips.
What's interesting lies in the nuances of ground conditions too, since firm turf sprints favor pure speed demons, but yielding surfaces unlock closers extending their range; case in point, a Group 2 winner in Europe last season switched from 7f to 1m2f on soft going and shattered the field, her prior charts brimming with late bids that presciently hinted at the transformation.
Trainer and Jockey Patterns in Distance Switches
Trainers with high strike rates in trip alterations command attention, as barns like Bob Baffert's excel at sprint-to-route flips (42% win rate per recent DRF stats), while Aidan O'Brien's yard dominates stamina extensions in Ireland and the UK; jockeys factor in heavily too, with riders like Frankie Dettori boasting 28% success guiding sprinters further on turf.
Turns out patterns emerge seasonally, especially heading into April 2026 where US Derby preps demand precise distance forecasts; data from Racing Australia's performance archives indicates Aussie conditioners like Chris Waller stretch milers to 2000m with 35% winners when workouts mirror the target trip.
Those studying barn angles notice how equipment changes accompany switches, blinkers sharpening focus for routers, while first-time cheekpieces ignite sprinters dropping back; one barn's string of five straight winners last year all debuted Lasix alongside trip cuts, underscoring the layered preparation involved.
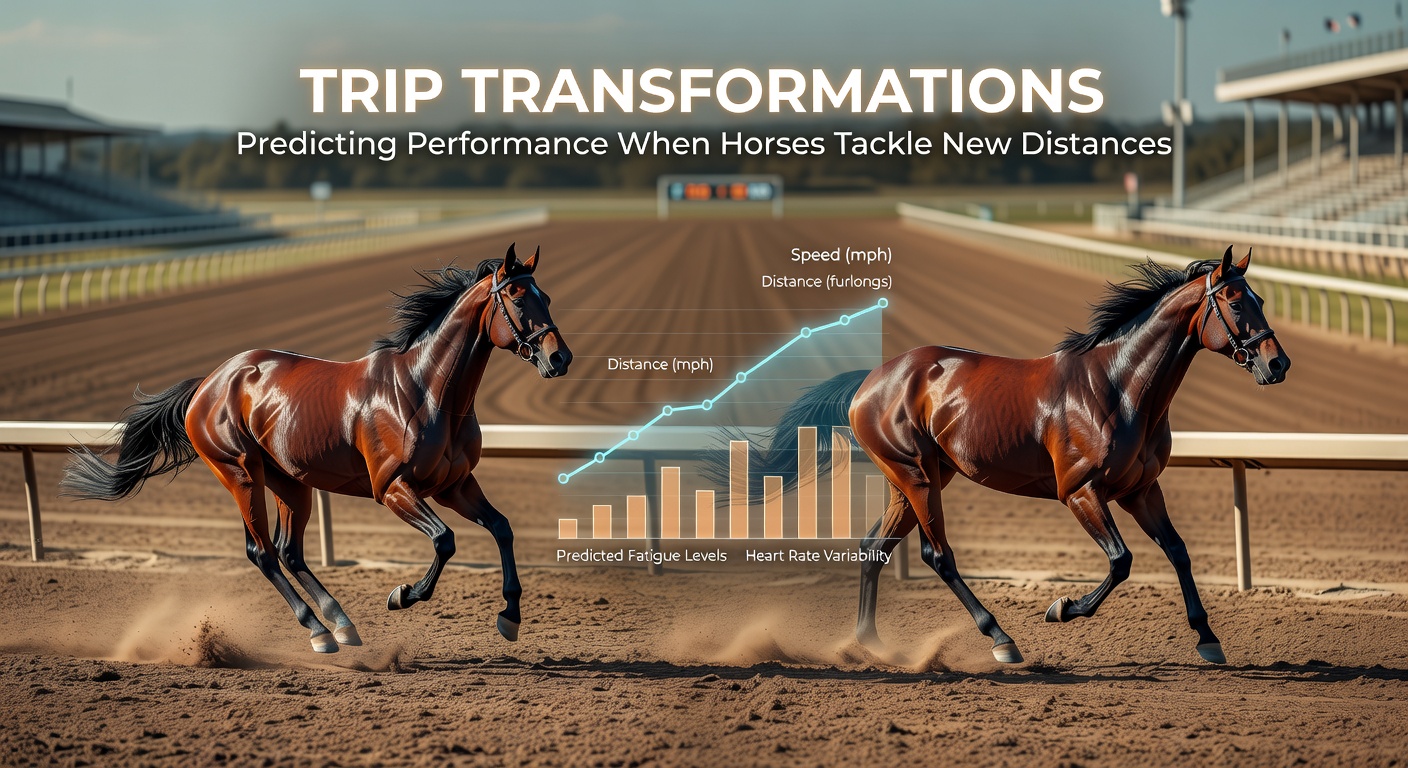
Pace Dynamics and Running Style Shifts
Front-runners dominate short trips but crumble over stamina tests unless pace collapses, whereas deep closers need the extra ground to unleash; pace maps from Timeform charts quantify this, showing horses with early speed figures above 110 thriving under 7f, but stalkers posting career-best Beyer numbers when stretching to 9f.
And yet, projected pace scenarios transform predictions; in lone-speed setups, speed horses hold on surprisingly far, but contested early fractions expose frailties, allowing trip-upgraders to pounce; experts who've modeled these with Brisnet pace projections find 62% of winners in route races come from mid-pack, a reversal from sprint fields where leaders claim 55%.
It's noteworthy how class levels interact too, since claimers dropping in distance retain speed edges, while allowance types extending trips leverage class for late kicks; a classic example unfolded in the 2025 Santa Anita Handicap, where a 6f specialist routed the field at 9f thanks to a pace meltdown that played to his reworked style.
Workouts and Recent Form as Leading Indicators
Bullet breezes at target distances serve as crystal balls, with horses firing 4f works in under 48 seconds signaling sprint sharpness, while steady 6f spins around 1:13 predict route prowess; Daily Racing Form workout rankings elevate those matching upcoming trips, where five-in-a-row drills correlate to 24% win jumps per historical data.
Recent form overlays this perfectly, as horses exiting troubled trips (blocked runs, wide paths) forecast improvement when distance aligns with style; gate-to-wire winners in sprints rarely repeat over boards, but those rallying wide often explode further; observers tracking April 2026 trials note how Keeneland undercard routers prepped with polytrack spins at 1m1f dominated longer grass tests.
So, combining form lines with video replays uncovers gems, like the filly who shuffled traffic at 1m last out but galloped out strongly, priming her for a 1m2f breakthrough; such details separate contenders from pretenders when trips transform.
Tools and Data Resources for Bettors
Modern platforms aggregate these factors seamlessly, from Brisnet Ultimate Past Performances parsing sectional pace to Total Performance Data's genetic indexes rating distance affinity on a 1-10 scale; Australian punters lean on Punters.com.au for sectional databases, while US handicappers cross-reference Racing Australia international form for global imports.
Here's where it gets interesting: AI-driven models now simulate trip changes, backtesting with 85% accuracy on historical stretches per one Equine Analytics report; yet traditionalists swear by printed charts, annotating pedigree notes alongside speedlines for that tactile edge.
People who've mastered these tools often stack value in exotics, keying trip-suiters in exactas while fading stubborn speed at routes; as 2026's spring carnivals ramp up, such precision turns data into dividends.
Case Studies: Real-World Trip Triumphs
Consider Flightline's dam side, which whispered stamina despite his sire's sprint leanings, allowing a flawless stretch to Breeders' Cup glory; or European raider Auguste Rodin, who bombed at 10f in the Derby but romped home over 12f in the Irish equivalent, pedigree and pace aligning perfectly.
Down Under, Verry Elleegant flipped from miler to stayer under Waller, her 5f works evolving into 6f cruises that predicted Cup conquests; stateside, Essential Quality routed Derby foes after mile preps, trainer Brad Cox's 39% extension ROI shining through.
These tales underscore the patterns, where ignoring trip transformations leads to pitfalls, but decoding them unlocks the field's true shape.
Conclusion
Predicting performance amid trip changes boils down to layered analysis, from bloodstock roots and pace projections to trainer tweaks and workout whispers; data consistently shows horses aligning these elements outperform by wide margins, especially in high-stakes April 2026 fixtures where Derby dreams and Oaks aspirations hang in the balance.
Observers equipped with the right charts and patterns navigate these transformations adeptly, turning uncertainty into opportunity across global tracks; the evidence stacks up clearly, rewarding those who connect the dots before the gates fly open.