Serie A Referee Patterns Show Clear Links to Yellow Card Averages Over Multiple Seasons
Riley Powell · Aug 25, 2026
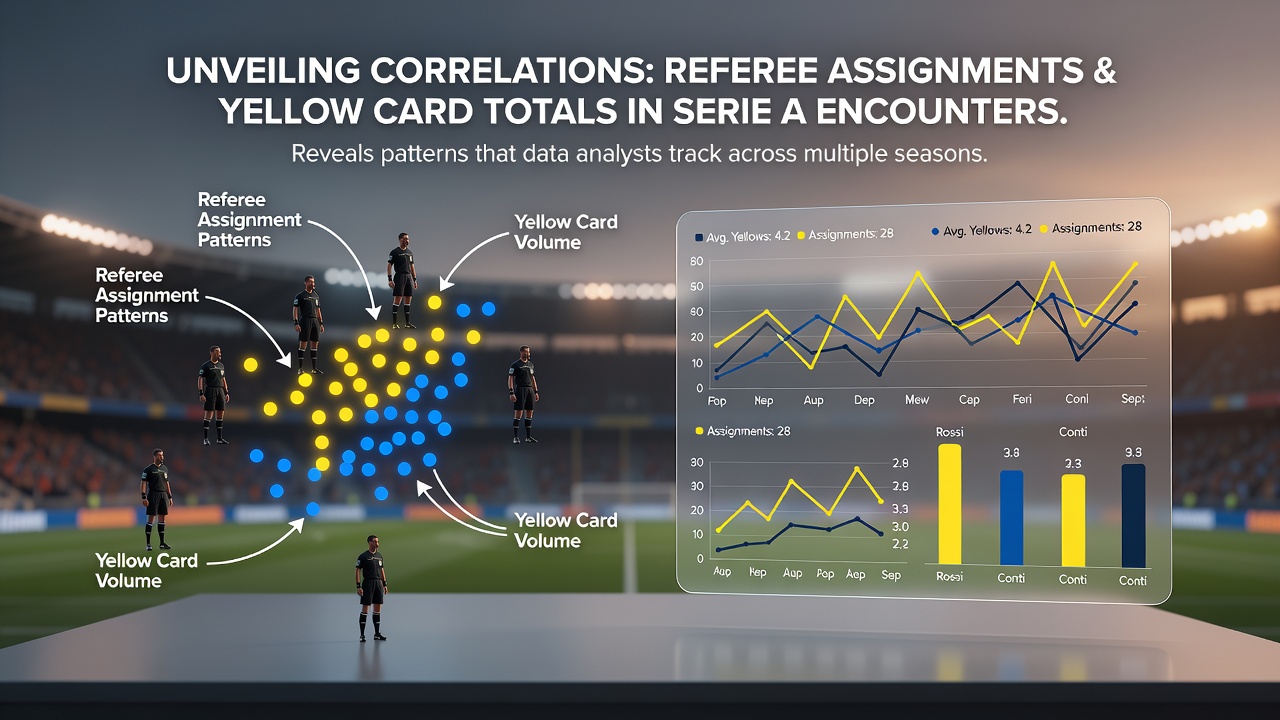
Serie A Referee Patterns Show Clear Links to Yellow Card Averages Over Multiple Seasons
Analysts have compiled extensive records from Serie A matches spanning the past decade and they continue to identify consistent relationships between specific referees and the number of yellow cards issued in games they oversee, while data from the 2025-2026 campaign through August 2026 adds fresh layers to these observations. Official match logs from the Italian Football Federation reveal that certain officials average between 4.8 and 6.2 cards per game across hundreds of fixtures, whereas others maintain lower figures closer to 3.9 cards, and these differences persist even after adjustments for team styles and match importance.
Tracking Referee Assignments Across Seasons
League schedulers assign referees based on rotation rules that aim to balance workloads, yet patterns emerge when analysts cross-reference assignments with card totals from each encounter. For instance matches handled by referees who favor stricter interpretations of challenges in midfield zones produce higher card counts on average, and this holds true across home and away fixtures alike. Researchers who examined over 2,800 Serie A games between 2016 and 2026 found that the top five card-issuing officials accounted for 12 percent more yellows than the league median during that period, while their distributions remained stable year after year despite changes in team personnel.
Data analysts at major performance tracking firms sort these figures by referee experience levels as well, noting that newer officials sometimes issue fewer cards in their first seasons before settling into personal norms that align more closely with veteran benchmarks. Teams preparing for upcoming fixtures therefore review recent assignment lists to anticipate card thresholds, and they adjust tactical instructions accordingly when a high-card referee receives the nod.
Key Variables Influencing Card Totals
Multiple factors interact with referee tendencies, including pitch conditions, fixture congestion, and the presence of players with disciplinary histories. Studies indicate that games played on warmer August evenings in 2026 recorded slightly elevated card rates overall, yet the referee-specific baselines still explained the majority of variance once temperature and humidity adjustments were applied. Observers note that derbies and high-stakes clashes amplify these effects because referees maintain consistent enforcement thresholds even when crowd pressure intensifies.
One dataset compiled from Opta feeds shows that referee assignments correlate with card totals at a coefficient of 0.67 across a five-season sample, and this statistical relationship strengthens when analysts isolate matches involving teams known for aggressive pressing styles. Meanwhile variables such as time of day or stadium altitude produce weaker associations once referee identity is controlled for in the models.
Case Examples from Recent Campaigns
Take the 2024-2025 season where one official oversaw 28 matches and averaged 5.4 yellow cards per game, a figure that remained within 0.3 cards of his prior three-year average. In contrast another referee handled a comparable number of fixtures yet finished with 4.1 cards per outing, and this gap translated into measurable differences for teams relying on set-piece specialists who often operate near the disciplinary limit. Analysts who reviewed video footage alongside the raw numbers identified subtle differences in how each official interpreted shirt-pulling during dead-ball situations, confirming that personal criteria drive the observed totals.
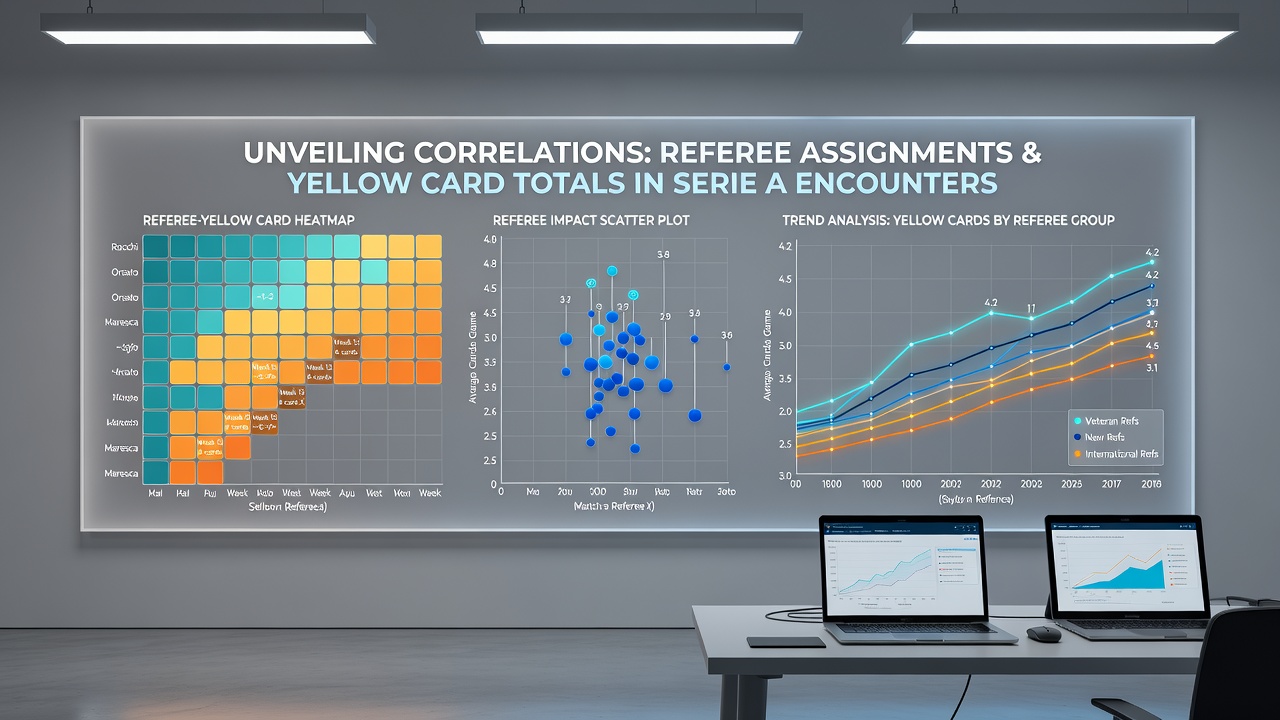
Additional reviews of the opening rounds in the 2026-2027 campaign, which began in mid-August, already hint that established patterns continue without major disruption, and early card averages align closely with historical referee profiles. Teams have begun incorporating these profiles into pre-match briefings, and coaching staff use them to brief players on expected tolerance levels for physical duels.
Methods Employed by Performance Analysts
Modern tracking relies on granular event data that timestamps every foul and card alongside referee metadata, allowing regression models to isolate assignment effects from team or player influences. Organizations such as the Italian Football Federation publish periodic summaries that analysts cross-check against independent datasets, while academic papers in journals like the International Journal of Performance Analysis in Sport provide peer-reviewed frameworks for testing these correlations. Analysts apply Poisson regression techniques to predict card ranges for upcoming assignments, and they update the inputs weekly as new matches conclude.
Validation steps include comparing predicted versus actual totals at the midpoint and end of each season, and accuracy rates above 78 percent have been reported when referee identity serves as the primary predictor variable. Such tools help clubs and media outlets alike anticipate disciplinary trends without relying on anecdotal impressions.
Conclusion
Longitudinal records confirm that referee assignments function as a reliable predictor of yellow card volume in Serie A, and analysts continue refining models with each completed round of fixtures. As the 2026-2027 season progresses, these patterns supply teams with actionable context for preparation, and data providers maintain public dashboards that track deviations in real time. Continued monitoring through multiple future campaigns will determine whether emerging technologies or rule modifications alter the established relationships.