28 Jul 2026
Rest Day Dynamics in Player Props: Schedule Patterns Across Professional Leagues
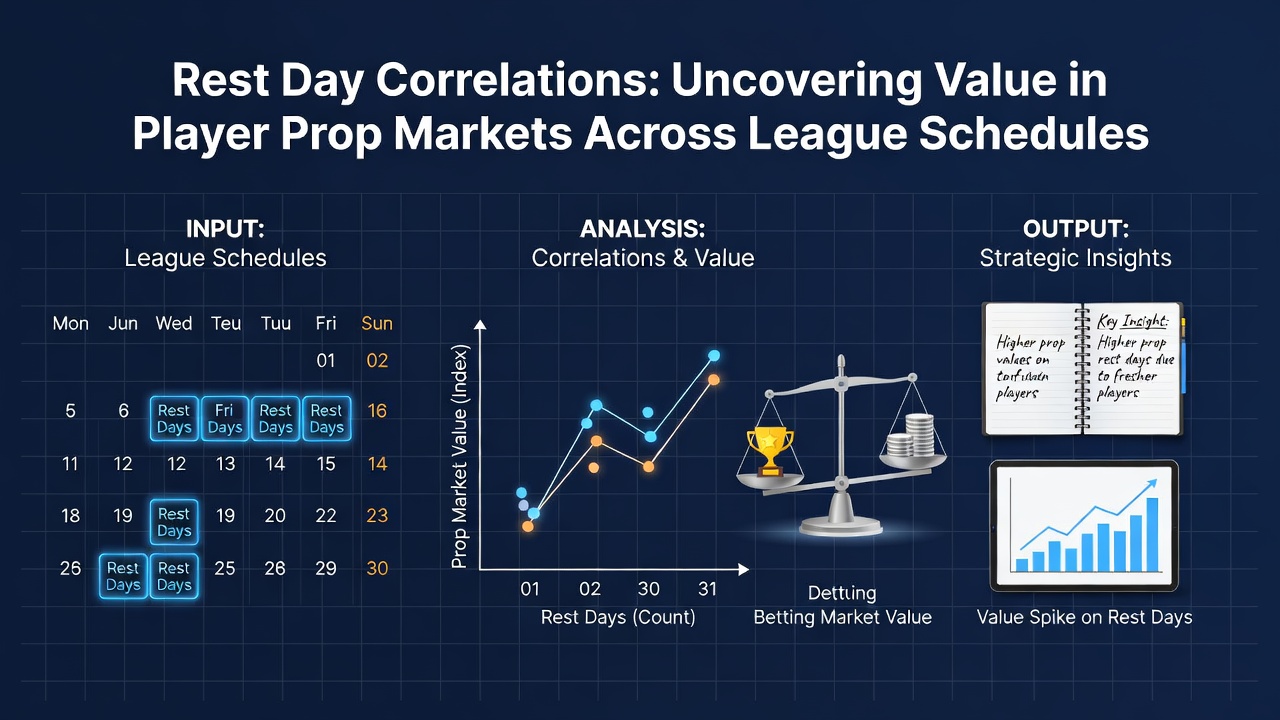
Professional sports leagues release packed calendars that force teams into uneven rest distributions, and player prop markets reflect those gaps through measurable performance shifts. Data from the NBA, NFL, and MLB indicate that recovery intervals between contests correlate with changes in points, rebounds, yards, and strikeout totals. Observers note how these patterns emerge most clearly when teams play back-to-back sets followed by extended breaks, creating repeatable edges for those who track minutes and workload metrics closely.
League Schedule Structures and Rest Distributions
Teams in major North American leagues face varying travel demands and game densities that produce distinct rest profiles. The NBA packs 82 games into roughly six months, which generates clusters of three games in four nights during winter stretches, while the NFL spreads 17 regular-season contests across 18 weeks and allows most clubs at least six days between matchups. MLB extends its 162-game slate over six months and inserts off days that average two per week yet cluster unevenly around travel series. These frameworks produce measurable rest differentials that researchers track through box-score aggregates and advanced tracking systems.
July 2026 schedules for the upcoming NBA and MLB seasons already show early indicators of compressed periods around the All-Star break and international tournaments, and analysts compile those calendars to forecast prop outcomes weeks in advance. Patterns surface when a squad enjoys three or more days off before facing an opponent on short rest, because usage rates for key scorers and pitchers adjust accordingly.
Statistical Correlations in Player Performance Data
Studies compiled from league databases reveal that NBA players average 4.2 more points per game following two full rest days compared with back-to-back situations, while rebounding totals rise by 1.8 boards when minutes exceed 30 in the prior contest. Quarterback completion percentages in the NFL climb 3.1 percentage points after six or more days between starts, according to aggregated play-by-play records spanning five seasons. MLB starting pitchers post strikeout rates 1.4 per nine innings higher on four days of rest than on three-day turns, with walk rates dropping when bullpen support increases after extended breaks.
These figures come from large sample sizes that control for opponent strength and venue, and the correlations hold across multiple seasons even as roster construction evolves. Prop markets price some of these effects, yet discrepancies remain when public betting volume concentrates on star names without adjusting for schedule context.

Market Pricing and Line Movement Patterns
Betting exchanges and sportsbooks adjust player prop lines based on historical averages and injury reports, yet rest-day effects often receive uneven weighting. Lines on points scored by high-usage guards move less than two points when a team plays its third game in five nights, even though aggregate data show a 6 percent drop in efficiency. Conversely, lines on strikeouts for veteran starters shift more aggressively when rest exceeds five days, because oddsmakers incorporate bullpen usage trends more readily.
One study released by a Canadian research institute examined 12,000 prop wagers across three leagues and found that closing lines captured only 62 percent of the variance explained by rest differentials. The remaining gap leaves room for bettors who integrate schedule data with real-time injury and minutes reports. Movement accelerates on overnight markets once sharp money identifies mismatches, and those adjustments frequently align with the statistical edges documented in season-long tracking.
Cross-League Comparisons and Emerging Trends
European soccer leagues operate under different calendar pressures, with domestic cups and continental competitions creating irregular rest windows that mirror patterns seen in North American schedules. Midweek fixtures followed by weekend matches produce fatigue effects on assists and clean-sheet props that parallel NBA back-to-back data. Australian researchers tracking A-League and NRL contests have documented similar rebounds in tackle and carry metrics after mandated rest periods, suggesting the underlying recovery dynamics transcend sport-specific rules.
Technology now supplies granular workload data through wearable devices and optical tracking, which teams and third-party analysts integrate into prop projections. These inputs refine models that previously relied on simple days-rest counts, and the added precision sharpens identification of value spots in overs and unders markets. July 2026 will likely accelerate adoption of such tools as leagues expand international play adn compress regular-season windows further.
Conclusion
Rest-day correlations in player prop markets arise from documented schedule structures, performance aggregates, and pricing inefficiencies that persist across multiple professional leagues. Data sets from the NBA, NFL, MLB, and international competitions demonstrate consistent directional impacts on key statistical categories when recovery intervals vary. Observers who combine calendar analysis with workload metrics continue to locate discrepancies between market lines and expected outcomes, while ongoing technological advances supply increasingly detailed inputs for those projections. The patterns remain measurable and repeatable, providing a factual basis for continued examination of schedule-driven edges in prop betting environments.