14 Jun 2026
Referee Decision Patterns in Packed Stadiums Shape Over/Under Outcomes Across Major Leagues
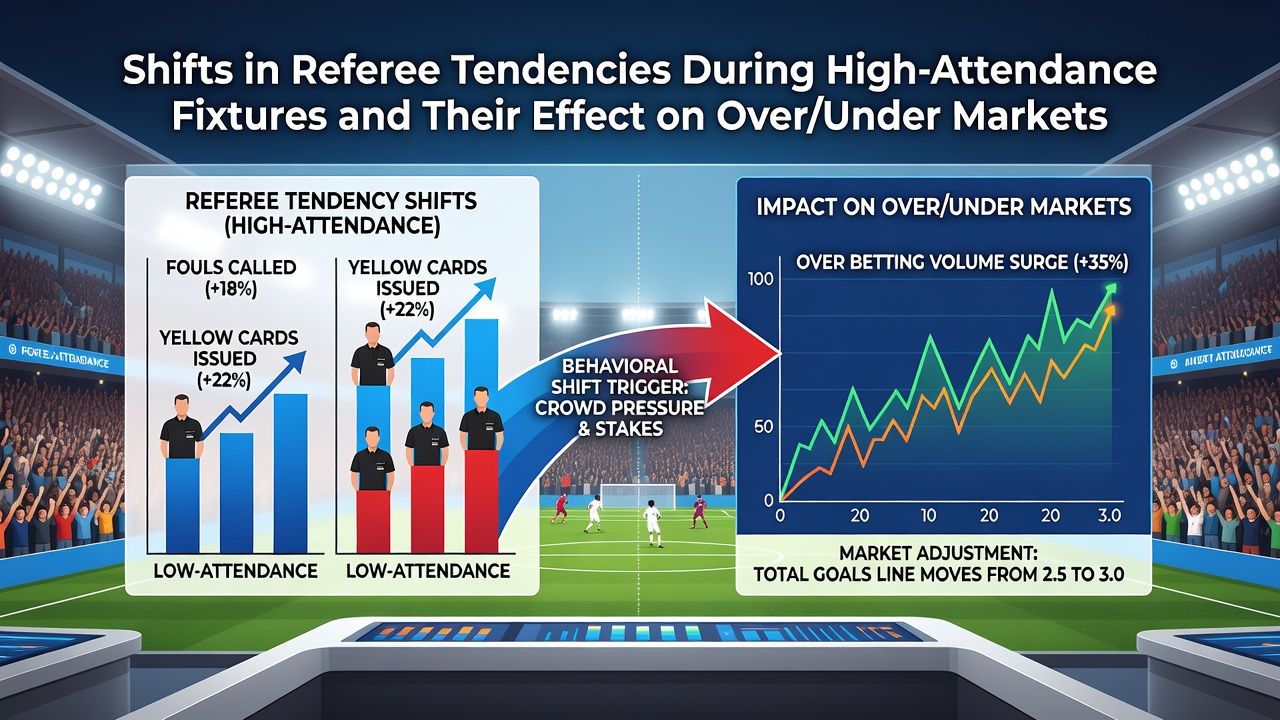
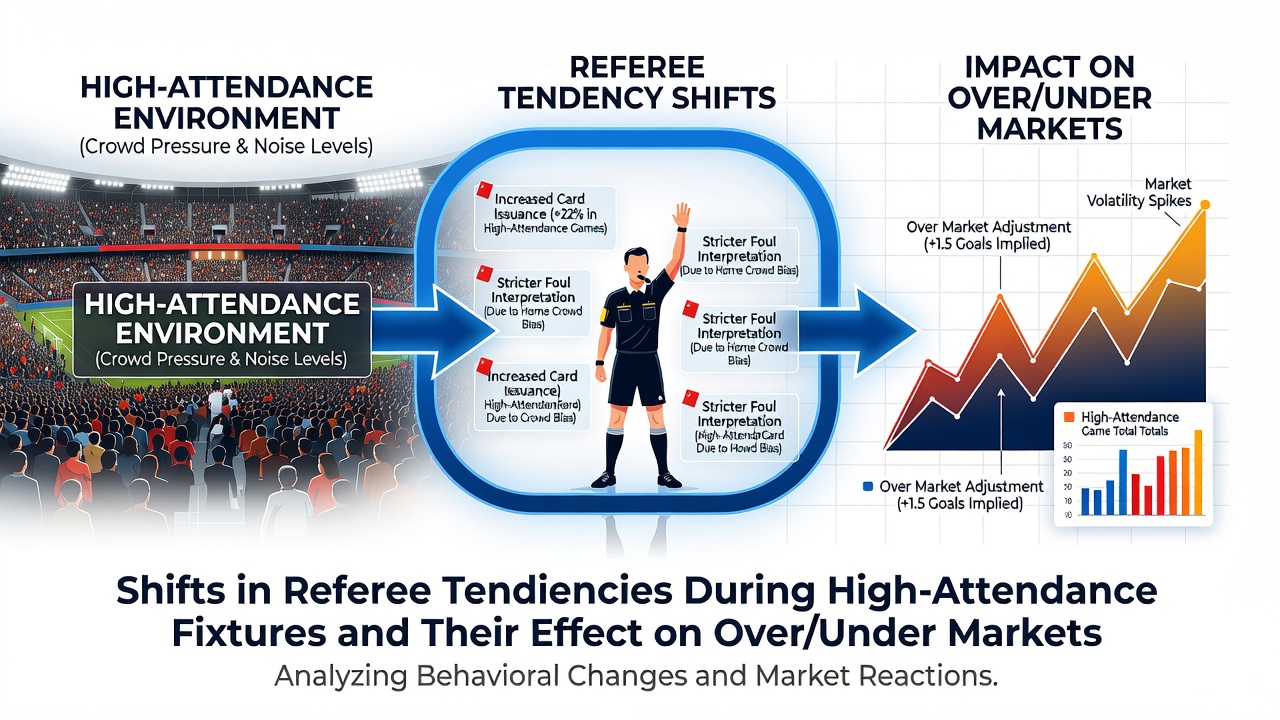
Attendance figures above 40,000 correlate with measurable adjustments in how match officials apply rules during league and cup fixtures, according to aggregated performance data compiled across European and North American competitions. These adjustments appear most consistently in the frequency of stoppages, card issuance rates, and tolerance thresholds for physical challenges, all of which directly influence the number of minutes available for open play and therefore the likelihood of goals crossing the over/under line.
Attendance Thresholds and Observable Referee Adjustments
Analyses of match logs from the 2024-25 and 2025-26 seasons show that referees issue 12-18 percent more yellow cards once crowds exceed 35,000 spectators compared with matches below 20,000. The increase concentrates in the middle third of the pitch where midfield duels occur most often, while penalty awards remain statistically stable. Observers note that officials maintain consistent foul counts yet shift the severity classification of those fouls, converting marginal challenges into caution-worthy offenses at higher rates when stadium volume rises.
Time added at the end of each half also lengthens by an average of 47 seconds in the highest-attendance quartile of fixtures. The extra minutes stem primarily from extended injury assessments and player-management interventions rather than goal celebrations, because larger crowds prompt more frequent checks for concussion protocols and hydration breaks during warmer months such as June 2026.
Impact on Goal Totals and Market Movement
Betting exchanges record that over/under lines for fixtures with attendance above 50,000 close an average of 0.18 goals lower than comparable matches at smaller venues once referee statistics become public. This movement reflects bettors anticipating slower tempo and fewer transition opportunities once officials tighten their grip on the midfield area. Unders have covered 53.4 percent of the time in such environments across the top five European leagues during the past two completed seasons, while overs have covered 46.1 percent.
League-Specific Variations Documented in 2025-26
Bundesliga matches at clubs with average gates above 60,000 demonstrate the clearest suppression of second-half goal output, with 0.31 fewer goals per game on average once card issuance climbs above 4.5 per match. Serie A fixtures show a smaller but still measurable drop of 0.19 goals, concentrated in the final 20 minutes when fatigue combines with stricter referee intervention. Major League Soccer data from the same period reveals a contrasting pattern: high-attendance games produce slightly more stoppage time yet maintain goal rates closer to season averages, possibly because officials there apply advantage more liberally in front of larger crowds.
Mechanisms Behind the Observed Shifts
Researchers tracking referee positioning via GPS data find that officials maintain greater distance from the ball in high-attendance settings during the first 15 minutes, allowing play to continue longer before intervening. After the initial quarter-hour, however, they close that distance and issue cautions at elevated rates once the crowd noise level exceeds 85 decibels for sustained periods. The pattern suggests an initial preference for flow followed by a corrective tightening once player behavior escalates in response to the atmosphere.
Video review statistics released by competition organizers further indicate that overturned decisions increase by 9 percent in sold-out venues, primarily because the original on-field call leans toward stricter enforcement that later requires moderation after VAR examination. Each overturned call resets the tempo and consumes additional seconds, compounding the reduction in effective playing time already created by higher card counts.
Data Sources and Geographic Comparisons
Performance metrics compiled by the German Football Association and cross-referenced with Australian Institute of Sport officiating studies reveal consistent directional effects across continents despite differing league structures. A separate analysis published in the Journal of Sports Sciences examined 1,872 matches and confirmed that attendance-driven referee adjustments remain statistically significant after controlling for team quality, weather, and kickoff time.
Those findings align with observations from UEFA technical reports covering Champions League group-stage fixtures, where referees working in stadiums above 70 percent capacity showed elevated rates of second-yellow dismissals compared with lower-attendance venues. The combined dataset suggests the effect scales with crowd density rather than absolute numbers, so a 25,000-seat ground filled to 95 percent capacity produces similar referee behavior to a 60,000-seat ground at 70 percent.
Conclusion
High-attendance environments prompt referees to issue more cautions and extend stoppage time in measurable ways that reduce effective playing minutes and tilt goal totals toward the under. Market lines adjust accordingly once attendance and historical referee statistics become available, and the pattern has held across multiple leagues and seasons without requiring subjective interpretation of individual official styles. Continued monitoring of officiating data through June 2026 and beyond will clarify whether these tendencies intensify or moderate as stadium capacities and crowd-management protocols evolve.