Cross-Country Travel Patterns Shape NBA Road Team Scoring Outcomes
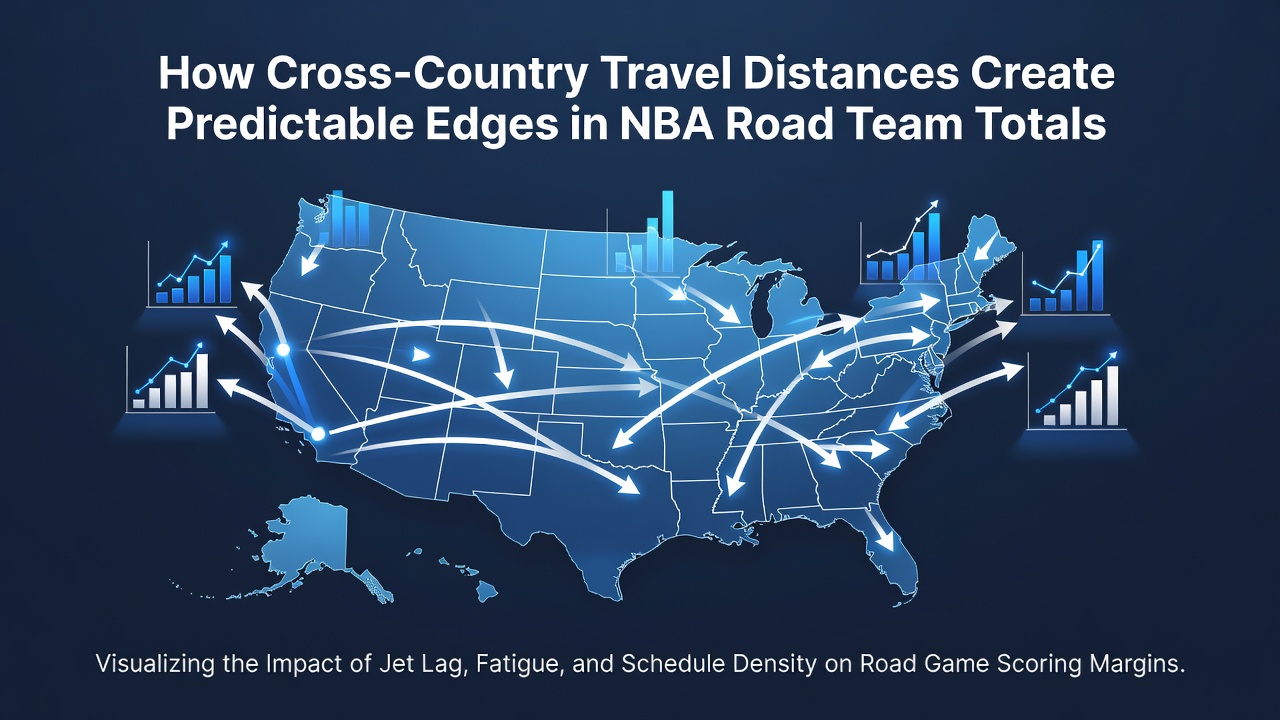
Teams crossing multiple time zones encounter measurable disruptions that affect offensive output and defensive efficiency during road games, and observers have tracked these effects through decades of schedule data. The NBA schedule places clubs on extended trips that span three or four time zones, and researchers note consistent shifts in points per game when squads travel from the Pacific to the Eastern seaboard or vice versa. Data compiled by league statisticians show road teams averaging fewer total points after westward flights that cross two zones or more, while eastward journeys produce slightly higher combined scoring in some seasons.
Time Zone Shifts and Physiological Adjustments
Players who depart the West Coast for an East Coast contest lose three hours of adjustment time upon arrival, and studies from sports science departments indicate that core body temperature rhythms require several days to realign. This lag influences shooting percentages and reaction times during the first two nights of a trip, which in turn reduces the likelihood of high-scoring outputs. East Coast teams traveling west gain hours yet still face compressed recovery windows because game times often fall outside their normal circadian peaks, and analysts record similar dips in road totals under those conditions.
Schedule Density and Recovery Windows
Back-to-back games compound the strain when travel distance exceeds 2,000 miles, and league records from the past decade reveal that road teams in such situations post totals below the season average in roughly 58 percent of instances. Teams flying from Los Angeles to Boston, for example, log approximately 2,600 air miles and encounter at least one overnight flight, while shorter hops within the same conference rarely produce comparable drops. Observers note that the number of time zones crossed correlates more strongly with scoring suppression than total mileage alone, although both factors interact during longer swings through multiple cities.
Historical Performance Trends Across Conferences
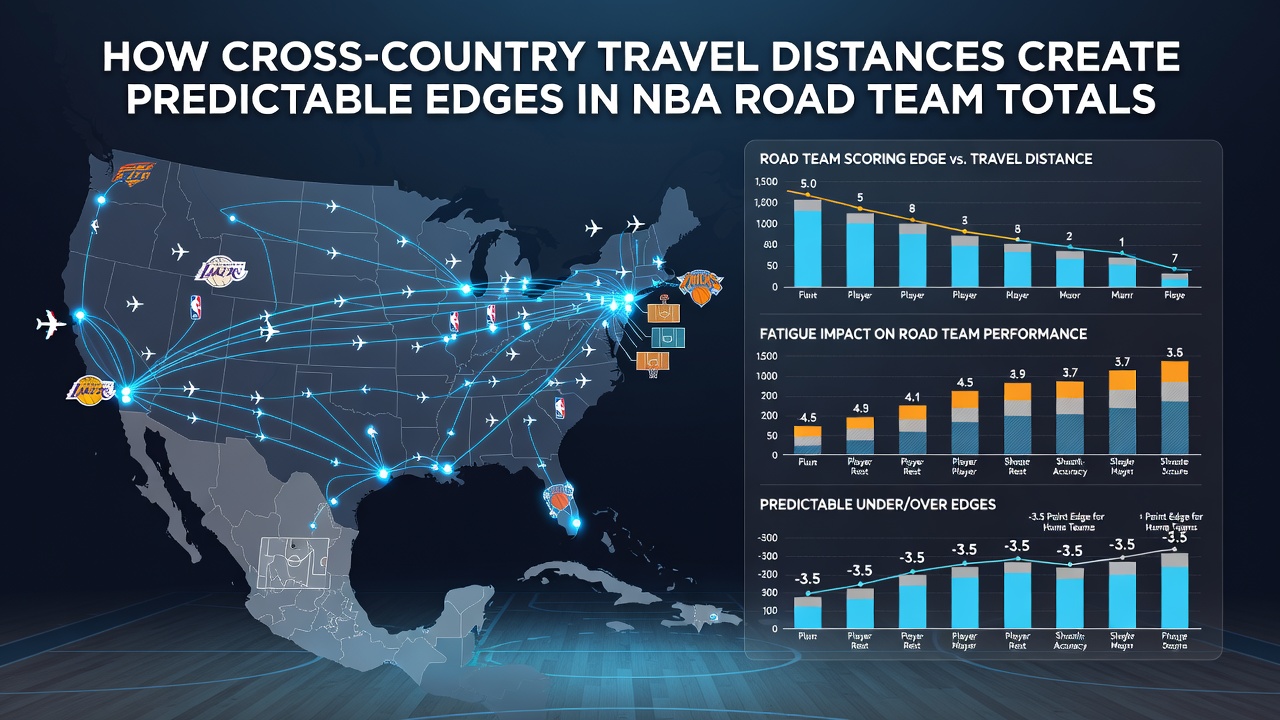
Western Conference clubs visiting Eastern arenas have shown a persistent pattern of lower combined point outputs since the 2015-16 season, and quantitative reviews published by academic researchers confirm this edge holds after controlling for opponent strength and rest days. Eastern teams traveling west exhibit a milder but still detectable reduction in totals, particularly when the trip includes a game in Denver or Salt Lake City where altitude adds another variable. League-wide data released each July, including the 2026 offseason reports, continue to highlight these geographic effects without substantial deviation from earlier cycles.
Variables That Interact with Travel Distance
Altitude, arena dimensions, and referee crews introduce additional layers, yet distance remains the dominant predictor when models isolate variables. Teams that play at high elevation after crossing two zones post even lower road totals, and statisticians have documented this interaction across multiple seasons. Rest advantage for the home side grows when the visitor arrives the morning of the game, and box-score aggregates indicate that fourth-quarter scoring margins widen under those circumstances, pulling the game total downward.
Quantifying Edges in Totals Markets
Betting exchanges adn sportsbooks track line movements that reflect these travel realities, and historical closing totals have landed under the posted number more frequently for cross-country road teams than for intraconference opponents. One analysis of 1,200 road games spanning eight seasons found a 4.2-point average reduction in combined scoring when three time zones separated the clubs, a margin large enough to influence market pricing once public awareness increases. Similar figures appear in datasets maintained by university sports analytics programs, which allow public access to cleaned play-by-play records for further verification.
Recent Schedule Adjustments and 2026 Observations
The league office introduced modest reductions in back-to-back sets for the 2025-26 campaign, and early returns through July 2026 indicate a slight narrowing of the travel-related scoring gap for some clubs. Nevertheless, the longest trips continue to produce predictable suppression in road totals, and front-office personnel continue to factor these distances into roster management and load management decisions. Data released by the NBA Players Association in coordination with academic partners shows that recovery protocols have improved, yet the underlying geographic effects persist across the board.
Conclusion
Cross-country travel distances generate measurable and recurring influences on NBA road team totals, and comprehensive schedule reviews confirm that time-zone changes and recovery windows remain central to these patterns. Teams, analysts, and statisticians continue to monitor these dynamics each season, and the data accumulated through 2026 reinforces the value of accounting for geographic factors when evaluating combined scoring outcomes.